We built a free tool that analyses your Sanity.io request logs entirely in your browser. Your logs are never uploaded anywhere.
The Problem
If you're using Sanity CMS, you've probably wondered:
- Which GROQ queries are slowing down my site?
- How much is each API call costing me?
- Are there any suspicious IPs hammering my endpoints?
- Should I be caching more requests through the CDN?
Sanity provides request logs, but they're raw JSON files, sometimes gigabytes of them. Making sense of that data typically means writing custom scripts, setting up log aggregation services, or just... guessing.
The Solution
InsanityLogs is a client-side log analysis tool that turns your Sanity request logs into actionable insights. Drop in a log file and you land in a mission-control dashboard: a live status grid, quick insights, and seven analysis tabs to work through.
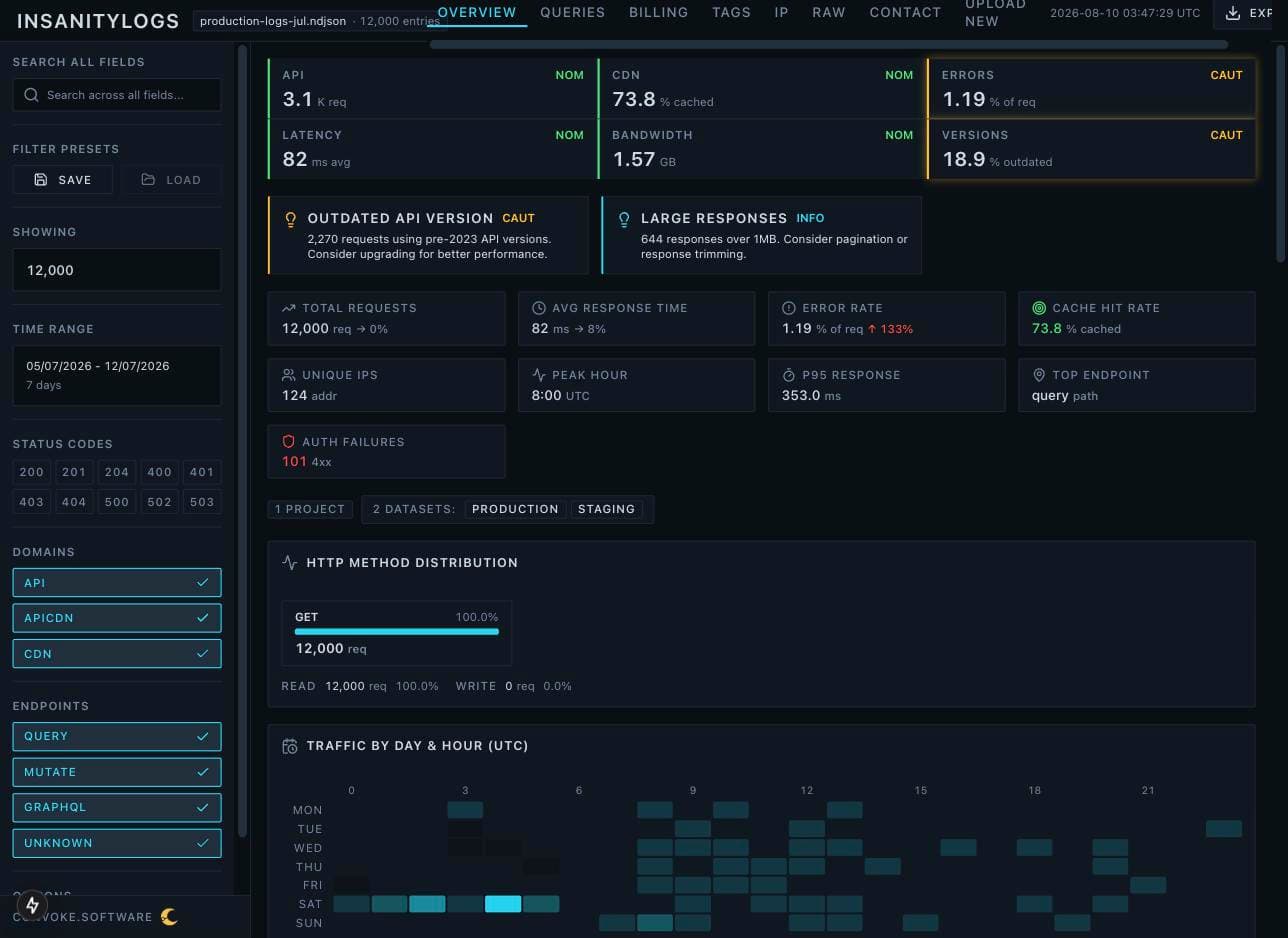
- Query Performance
- Which GROQ queries are slowest, most frequent, or returning the largest payloads
- Cost Estimation
- Approximate costs per query and endpoint for optimisation opportunities
- Security Analysis
- Suspicious IPs, potential credential stuffing, and rate limit candidates
- Traffic Patterns
- Request distribution over time, API vs CDN usage, and bandwidth breakdown
- Anomaly Detection
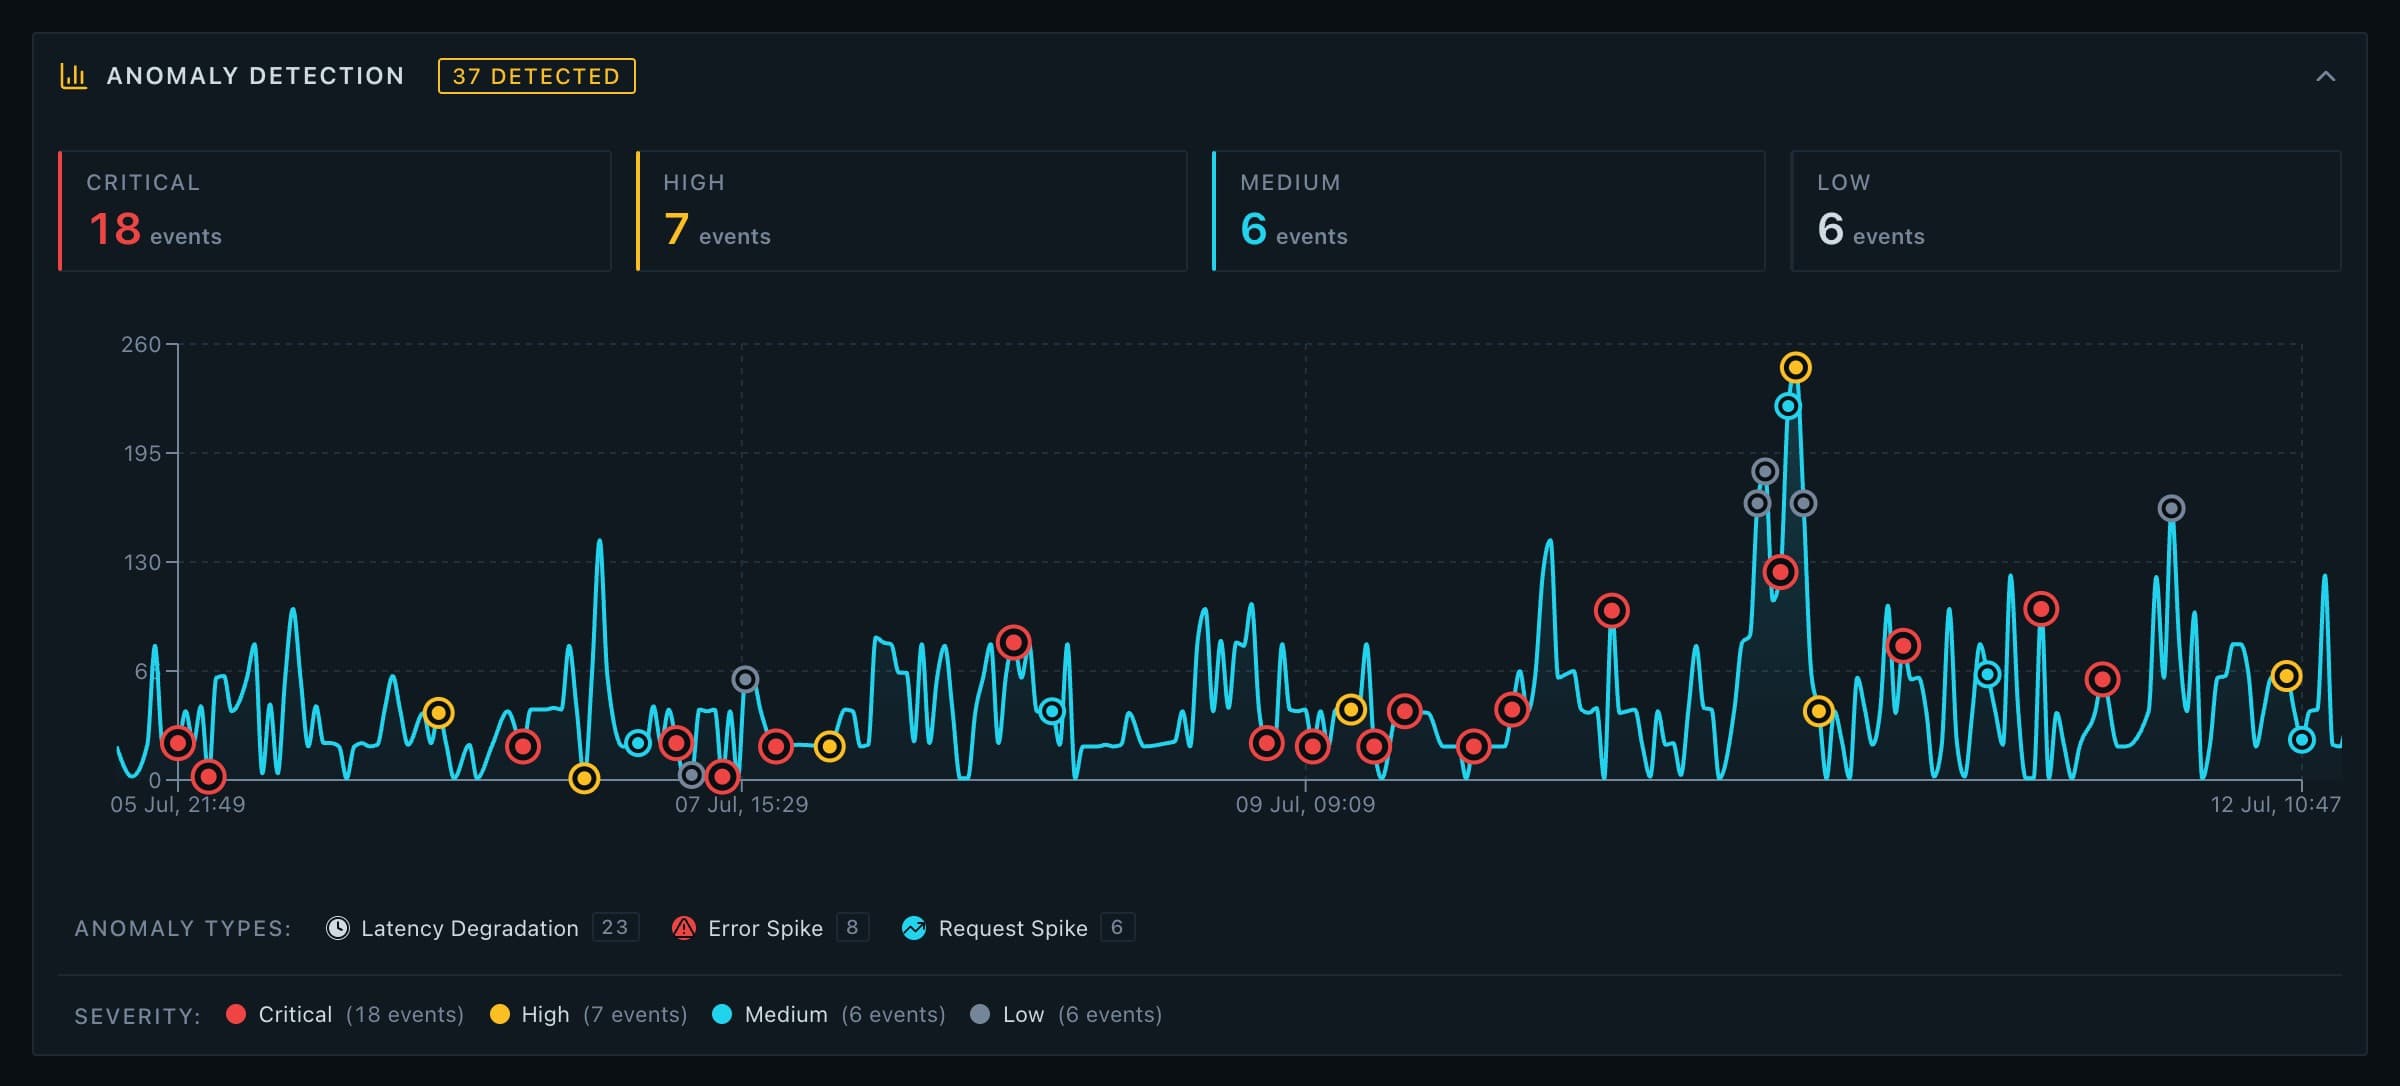
- Automatic detection of traffic spikes, error bursts, and latency degradation
- Actionable Insights
- Insight cards that name the specific problem: large payloads, slow queries, a traffic spike
Privacy First
Here's the thing about log data: it's sensitive. It contains IP addresses, user agents, and detailed information about your API usage patterns.
That's why the analysis runs entirely in your browser. Your log files are never uploaded anywhere. There's no server holding your data, no database, no analytics tracking.
There is exactly one exception, and we'd rather name it than bury it: the optional IP location lookup. If you turn that feature on, the IP addresses being looked up are sent to a geolocation service so the tool can show you where traffic is coming from. It is off by default, and everything else works without it. Your log file itself is never part of that call.
This isn't just a privacy feature; it's a core design principle. We built this tool to be something we'd trust with our own production logs.
How It Works
- 01
Download your logs
From the Sanity dashboard (Settings → Request Logs)
- 02
Upload to InsanityLogs
Drag & drop or use the file picker
- 03
Explore the dashboard
Seven analysis tabs of filterable, interactive visualisations
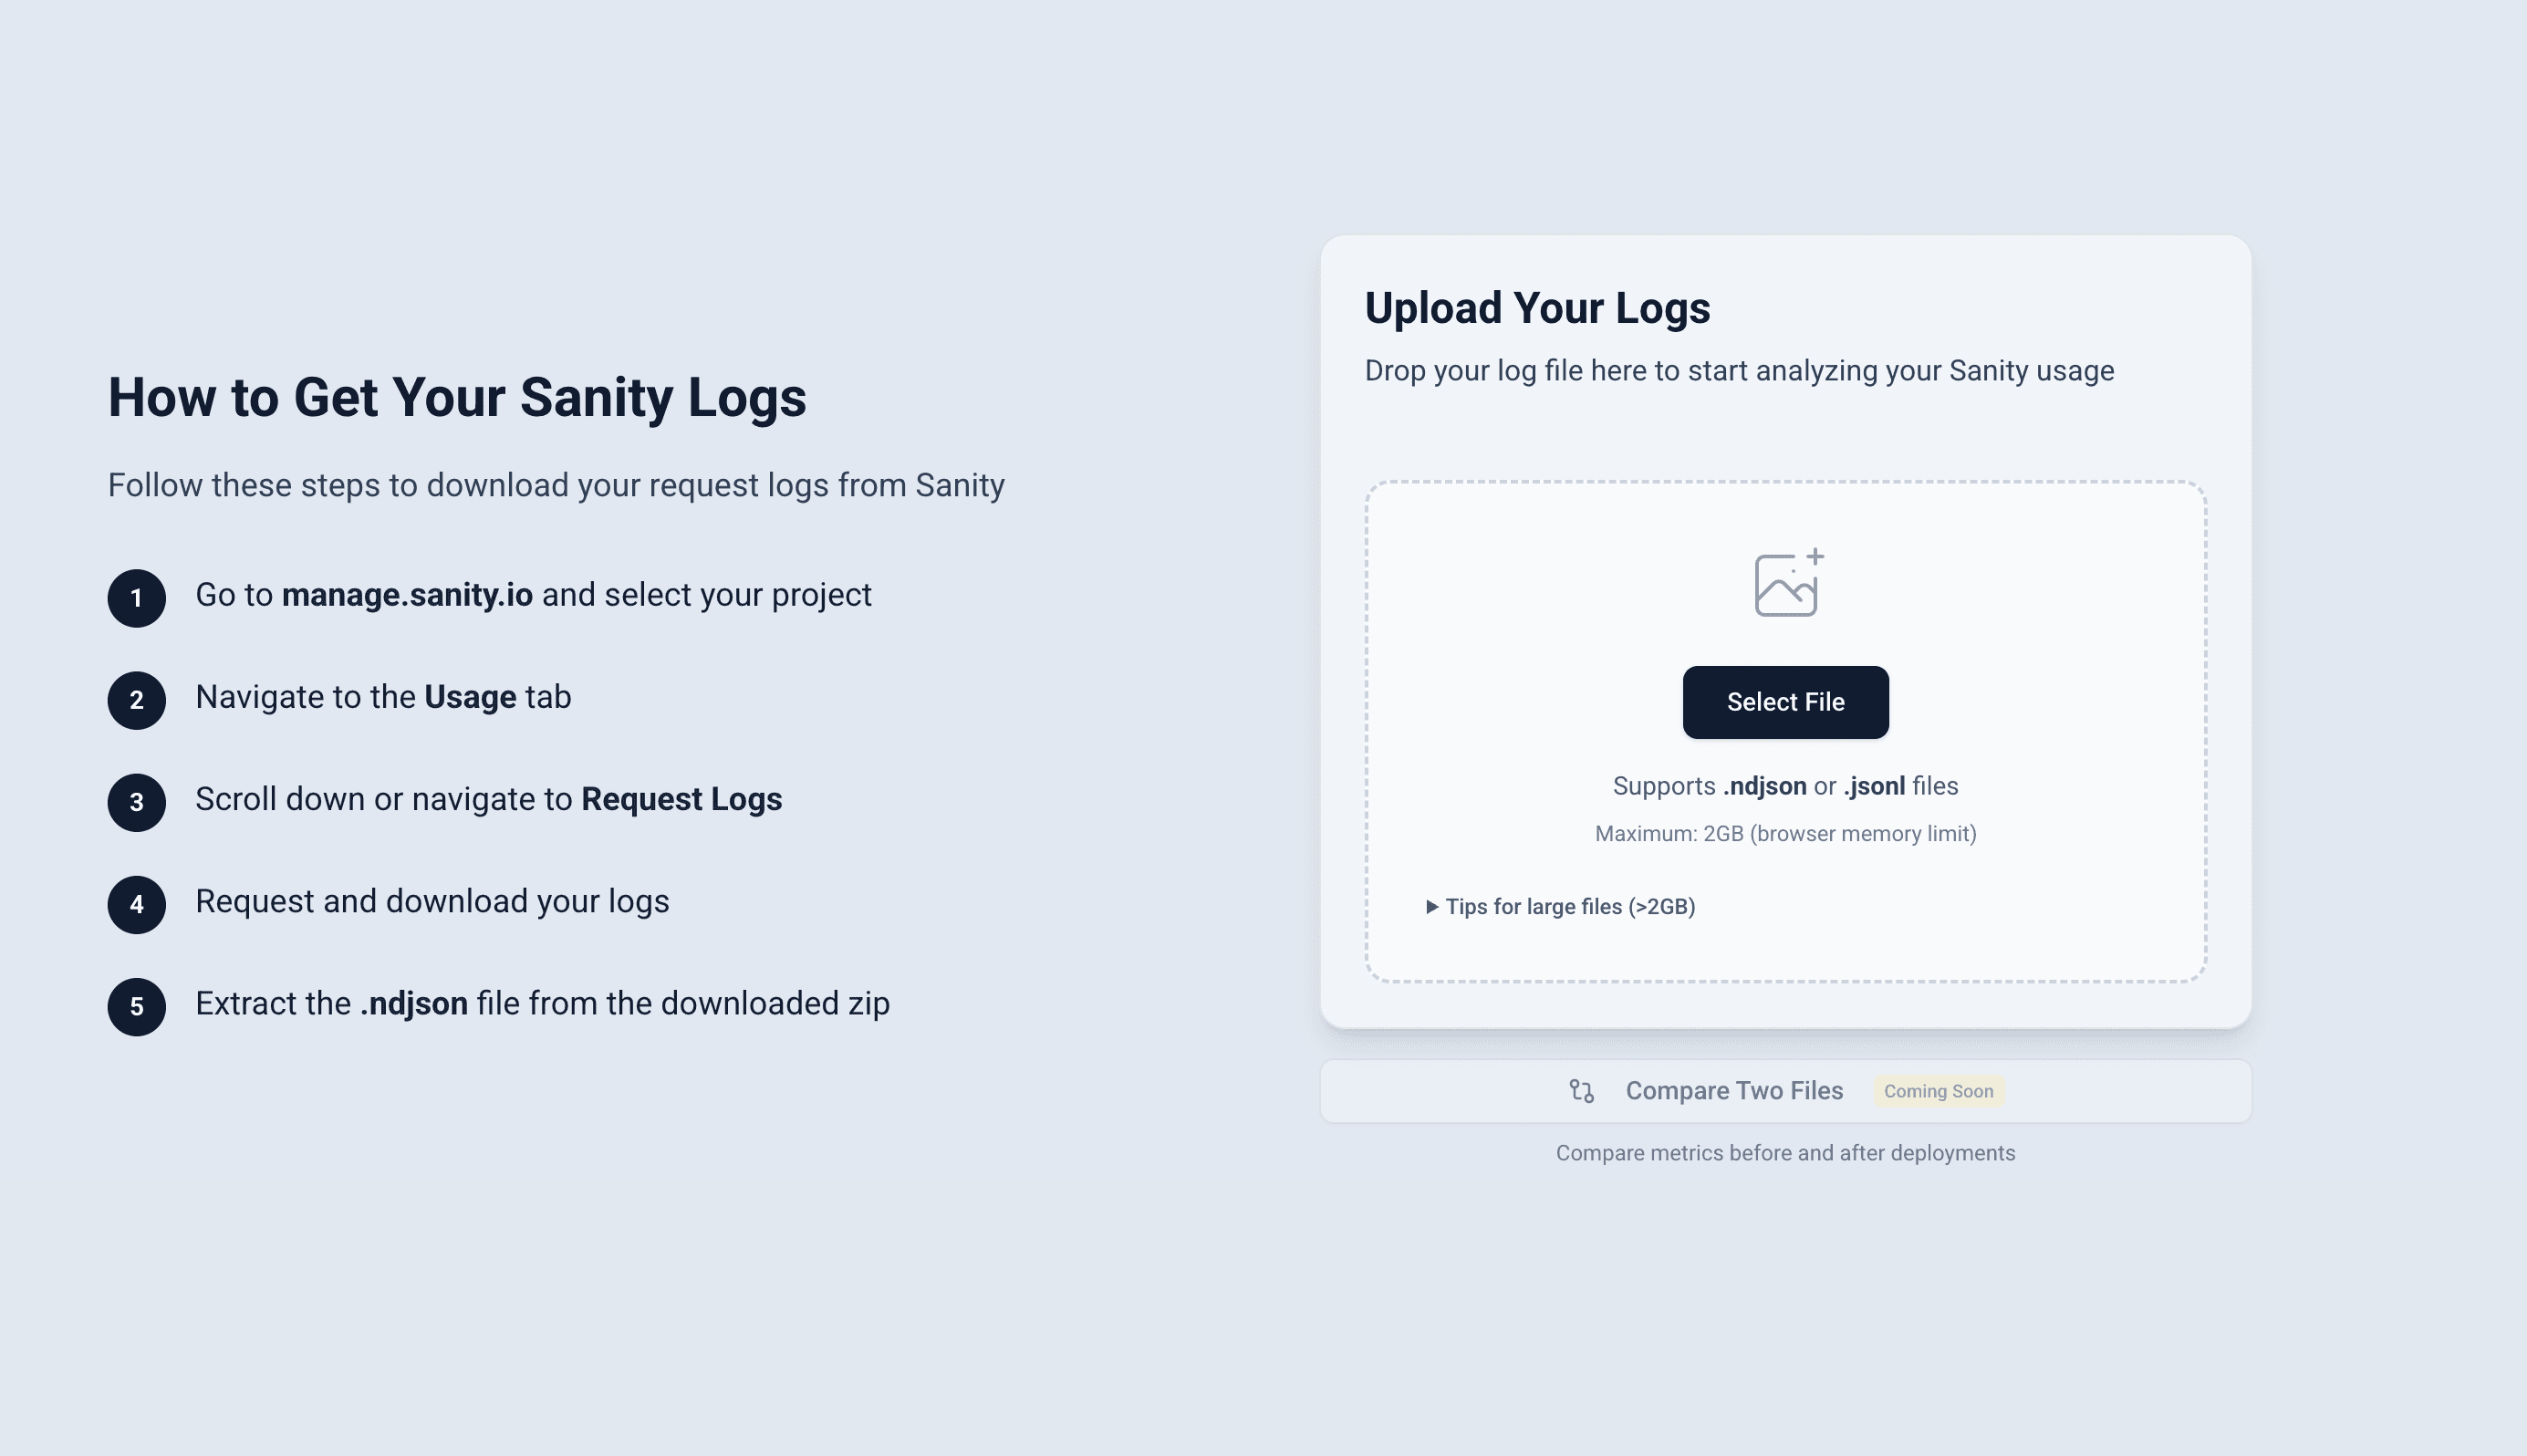
The tool handles files up to 2GB. They're streamed through a background Web Worker rather than loaded into the page, so the statistics cover the whole file and the tab stays responsive while it works.
Key Features
Query Analysis
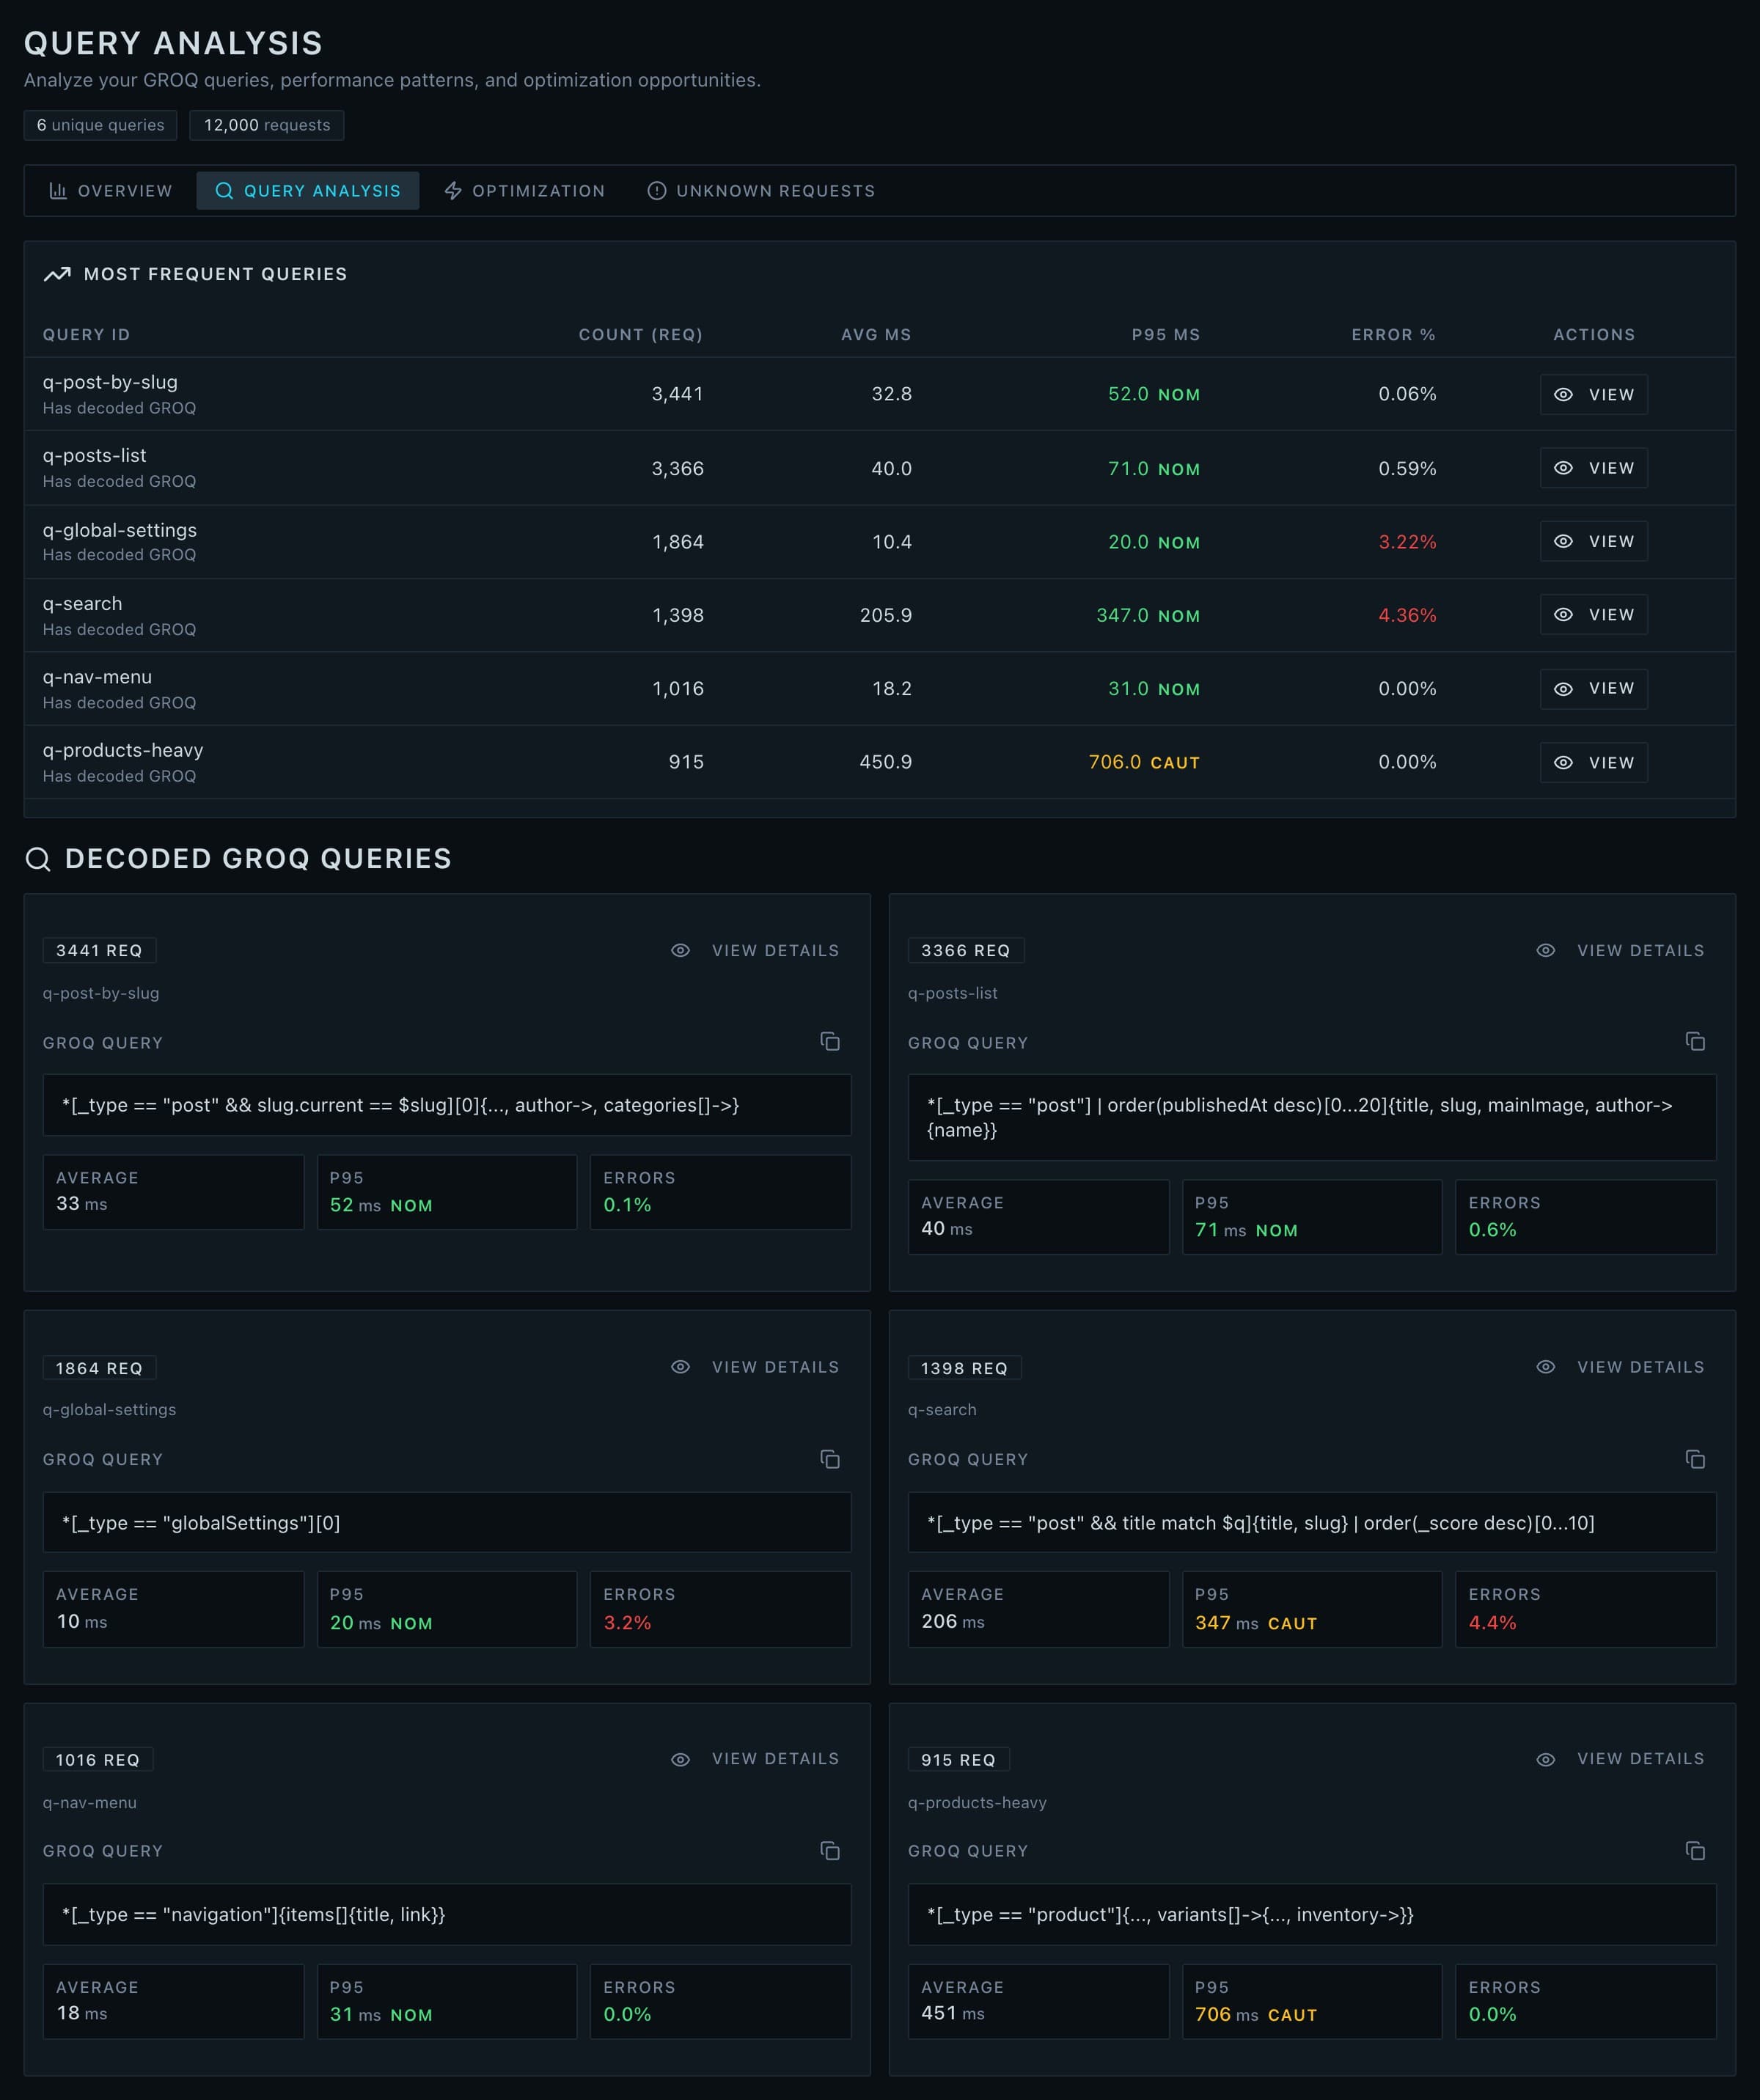
The queries tab decodes each GROQ query and gives it a card of its own, with average and p95 latency and an error rate next to the query text. Rank by frequency, latency, error rate, or response size, then open a query for full percentile breakdowns (p50, p90, p95, p99) and sample requests.
Cost Estimation
Get a rough estimate of what each query and endpoint is costing you. While these aren't exact billing numbers, they're useful for relative comparisons: identifying which 20% of queries are responsible for 80% of costs. When the tool surfaces something expensive, the fixed-price Sanity CMS audit is where we dig into why and fix it.
Traffic Signals
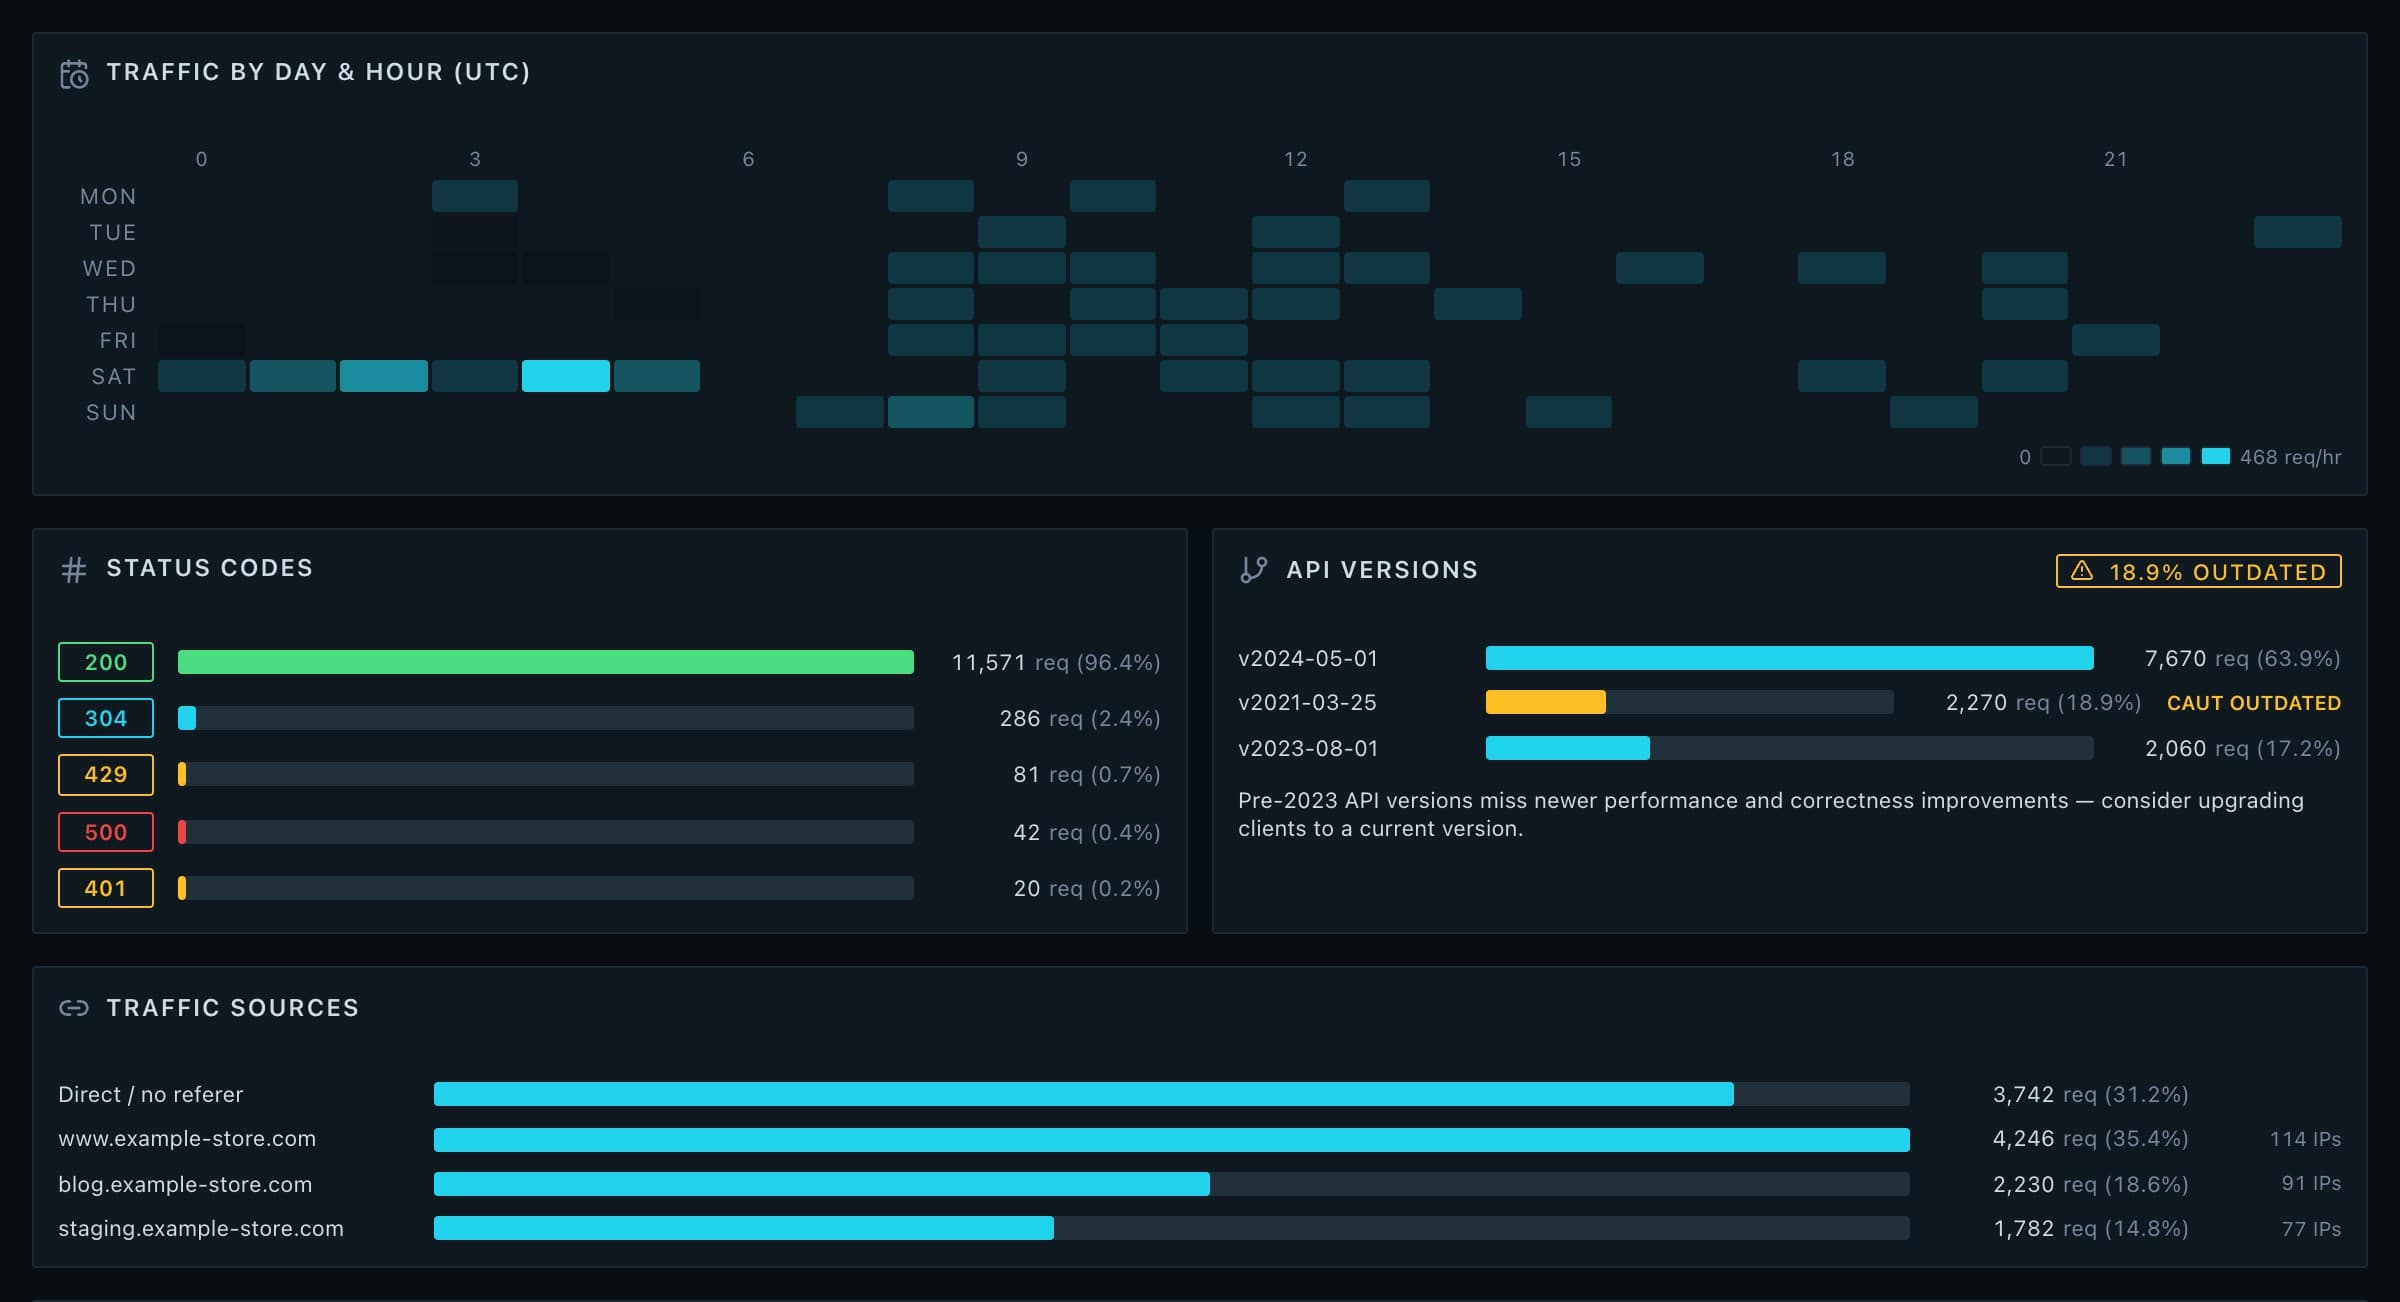
A heatmap lays your traffic out by UTC day and hour, so the quiet windows and the daily peaks are obvious at a glance. Alongside it sits the status-code breakdown, where your traffic is coming from, and a list of the API versions in play, with a warning on any outdated version still being called.
Anomaly Detection
Traffic spikes, error bursts, and latency degradation are detected for you and marked directly on the traffic curve, with severity counts above it. Instead of scrolling a chart hunting for the moment things went wrong, you get pointed at it.
Security Insights
Automatically flag IPs with unusual behaviour: high error rates, request bursts, user agent rotation, or patterns consistent with scraping or credential stuffing. Each flagged IP gets a threat score and recommended action (block, rate limit, investigate, or monitor). If you switch on the optional IP location lookup, those addresses get a country and region against them too.
Tag-Based Feature Tracking
If you use Sanity's tag feature, InsanityLogs groups your queries by tag so you can monitor the health of specific features in your application.
Export Reports
Generate PDF reports, CSV data exports, or PNG screenshots to share with your team or stakeholders.
Technical Details
For those interested in the implementation:
- Framework
- Next.js 15 (App Router)
- Language
- TypeScript (100% type-safe)
- Charts
- Recharts
- UI
- shadcn/ui + Tailwind CSS
- Compression
- fflate for gzip
- PDF Generation
- jsPDF + html2canvas
- Pipeline
- Streaming parser + Web Worker
- External calls
- Optional IP location lookup only
Large files use a streaming aggregator running inside a Web Worker. It processes entries incrementally and computes statistics without ever holding the whole file in memory, which is what keeps a 2GB export from taking the tab down with it.
Limitations
Being browser-based has tradeoffs:
- File size limit
- 2GB maximum (browser tabs are limited to 2-4GB of memory)
- No persistence
- Analysis is lost when you close the tab
- Single machine
- Can't share dashboards with teammates (yet)
For files larger than 2GB, we provide CLI commands to split or sample your logs before uploading.
Latest Updates
InsanityLogs is still in beta and under active development. Recently shipped:
- The mission-control dashboard: live status grid, quick insights, and seven analysis tabs
- Anomaly detection: traffic spikes, error bursts, and latency degradation on a severity timeline
- Traffic signals: a UTC day-by-hour heatmap, status-code breakdown, and outdated API version warnings
- Optional IP location lookups for flagged addresses (off by default)
About
InsanityLogs is built by Convoke Software, a development consultancy based in Vancouver, BC. Feedback, feature requests, or bug reports: insanity-logs@convoke.software.
Beta as of May 2026. Cost estimates are approximations and may not reflect actual Sanity billing. Use insights as guidance, not absolute values.